Analytics
How Analytics Work
Plandalf analytics convert user actions into activities that are then aggregated into your analytics dashboard. Here's how the process works:
1. Tracking User Actions
Start by tracking specific actions in your billing workflow. Each tracked action becomes an activity in your analytics:
// User enters billing flow
plandalf.intel.action('entry', {
  flow: "upgrade-button",
  placement: "editor-overlay",
  scenario: "first-time"
});
2. Activity Processing
When an action is tracked:
- A new activity record is created
- The activity is enriched with metadata
- The activity is processed in real-time
- Activities are aggregated into insights
Supported Event Types
Plandalf supports the following analytics events:
Entry Events
Entry events mark the beginning of a potential flow. They track when a user encounters a trigger point (like a paywall or upgrade button) but haven't actively engaged yet. This helps measure exposure and potential reach.
// Track when user encounters a paywall
plandalf.intel.action('entry', {
  flow: "premium_features",
  placement: "in_app",
  scenario: "usage_limit",
  element: "pro-features-wall",
  restriction: {
    reason: "usage_limit",
    message: "You've reached your template limit",
    current: 45,
    limit: 50
  }
});
Start Events
Start events indicate active user engagement with a flow. They're triggered when a user takes an action to begin the process, like clicking an upgrade button. This marks the true beginning of user engagement.
plandalf.intel.action('start', {
  flow: "premium_features",
  element: "upgrade-button"
});
Comparison Events
Comparison events track how users evaluate options. They should be called each time the user modifies their selection or filters, allowing you to track the full decision-making process. Each new comparison overwrites the previous state.
plandalf.intel.action('comparison', {
  element: "upgrade-today-grid",
  renew_interval: "P1Y",
  currency: "AUD",
  variant_filters: {
    billing: "annual",
    team_size: "small"
  }
});
Transaction Events
Transaction events capture purchase attempts and updates. Call this event whenever the transaction details change (quantity updates, plan changes, etc.). Like comparison events, each new transaction event represents the current state.
plandalf.intel.action('transaction', {
  id: "checkout_123",
  items: [{
    id: "plan_xxx",
    quantity: 12
  }],
  currency: "USD",
  intent: "upgrade"
});
Complete Events
Complete events mark the successful end of a flow. This should be called once when the flow reaches its intended outcome (like a successful purchase). This event closes the current flow.
plandalf.intel.action('complete', {
  result: "transaction_successful",
  flow: "premium_features",
  scenario: "usage_limit"
});
Cancel Events
Cancel events indicate that a flow was abandoned or stopped before completion. Like complete events, this closes the current flow but indicates an unsuccessful outcome.
plandalf.intel.action('cancel', {
  type: "navigate",
  reason: "user_exit",
  element: "close-button"
});
Error Events
Error events track failures during a flow. Unlike cancel events, errors don't necessarily end the flow - they indicate issues that might need resolution.
plandalf.intel.action('error', {
  message: "Payment verification failed",
  reason: "card_declined"
});
Interaction Events
Interaction events track specific user actions within a flow that don't change the overall state. Use these for UI interactions like navigating between pages in a walkthrough or toggling options that don't affect the comparison/transaction.
plandalf.intel.action('interaction', {
  scene: "pricing-page",
  element: "currency-selector",
  value: "EUR"
});
Custom Events
Custom events allow tracking of any additional data points that don't fit the standard events. Use these for specialized metrics or unique flow requirements that are hard to measure with standard events.
plandalf.intel.action('custom', {
  type: "feature_comparison",
  feature: "api_access",
  duration_ms: 5000
});
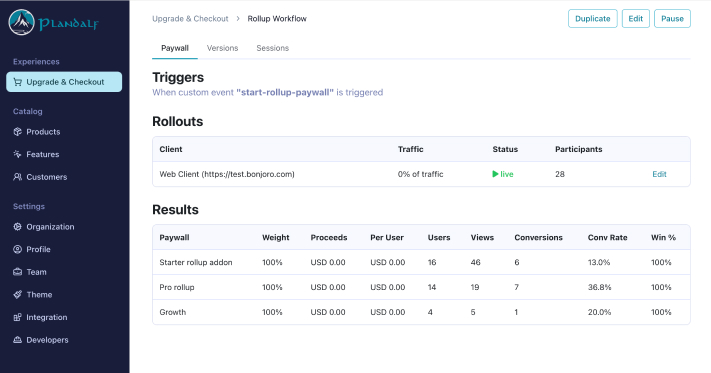
3. Dashboard Visualization
Your dashboard automatically updates to show:
- Complete funnel visibility across all steps
- Real-time conversion monitoring
- Drop-off points and bottlenecks
- Revenue impact of each step
Key Metrics Tracked
The analytics dashboard provides several key insights:
| Metric | Description | Example |
|---|---|---|
| Conversion Rate | Percentage of users completing each step | 68.5% completed pricing |
| Drop-off Points | Where users leave your funnel | 15.2% leave at pricing |
| Revenue Impact | Financial effect of each step | $5.2k lost at checkout |
| User Patterns | Common paths through your funnel | 72% view pricing first |
Best Practices
-
Design Your Flow
- Map out your unique billing workflow
- Identify key interaction points
- Determine which events make sense where
- Remember flows can be non-linear
-
Track Experiments
- Use the
scenariokey to differentiate variants - Compare different workflow designs
- Test different entry points and placements
- Track impact of UI/UX changes Example:
javascript// Variant A: Direct upgrade button plandalf.intel.action('entry', { flow: "upgrade", scenario: "direct_cta", placement: "header" }); // Variant B: Feature-triggered upgrade plandalf.intel.action('entry', { flow: "upgrade", scenario: "feature_triggered", placement: "in_app" }); - Use the
-
Maintain Flow Context
- Keep flow and scenario consistent within a session
- Use interaction events for minor UI updates
- Call comparison/transaction events when state changes
- End flows explicitly with complete/cancel
-
Measure What Matters
- Focus on events that impact conversion
- Track user decision points
- Monitor error and drop-off patterns
- Use custom events for unique insights
Next Steps
After implementing analytics:
- Set up your dashboard views
- Configure alerts for key metrics
- Start A/B testing improvements
- Monitor revenue impact
Need help setting up analytics for your custom implementation? Contact our team for support.